Spatial and Temporal Variability in Rainfall Erosivity Under Alpine Climate: A Slovenian Case Study Using Optical Disdrometer Data
 Nejc Bezak
 Sašo Petan1,2
  Matjaž Mikoš
- 1Faculty of Civil and Geodetic Engineering, University of Ljubljana, Ljubljana, Slovenia
- 2Slovenian Environment Agency, Ljubljana, Slovenia
Rainfall erosivity is one of the most important parameters that influence soil erosion rates. It is characterized by a large spatial and temporal variability. For example, in Slovenia, which covers around 20,000 km2, the annual rainfall erosivity ranges from less than 1,000 MJ mm ha−1 h−1 to more than 10,000 MJ mm ha−1 h−1. Drop size distribution (DSD) data are needed to investigate rainfall erosivity characteristics. More than 2 years of DSD measurements using optical disdrometers located at six stations in Slovenia were used to investigate the spatial and temporal variability in rainfall erosivity in Slovenia. Experimental results have indicated that elevation is a poor predictor of rainfall erosivity and that erosivity is more strongly correlated to the mean annual precipitation. Approximately 90% of the total kinetic energy (KE) was accounted for in about 35% of 1 min disdrometer data. The highest 1 min intensities (I) and consequently also KE values were measured in summer followed by autumn and spring. The local KE-I equation yielded an acceptable fit to the measured data in case of all six stations. The relatively large percentage of 1 min rainfall intensities above 5 mm/h can at least partially explain some very high annual rainfall erosivity values (i.e., near or above 10,000 MJ mm ha−1 h−1). Convective and large-scale precipitation events also result in various rainfall erosivity characteristics. The station microlocation and wind impacts in case of some stations yielded relatively large differences between the data measured using the optical disdrometer and the pluviograph. Preliminary conclusions have been gathered, but further measurements are needed to get even better insight into spatial and temporal variability in rainfall erosivity under Alpine climate in Slovenia.
Introduction
Rainfall erosivity is one of the main drivers of soil erosion, while erosion by water is one of the most studied types of erosion (Bezak et al., 2021b; Borrelli et al., 2021). Rainfall erosivity is often characterized by large spatial and temporal variability (Meusburger et al., 2012; Panagos et al., 2015a, 2016a; Nearing et al., 2015; Mondal et al., 2016; Petek et al., 2018). It is also one of the parameters used by the Revised Universal Soil Loss Equation (RUSLE) or Universal Soil Loss Equation (USLE) model types (Bezak et al., 2015b; Carollo et al., 2017; Yue et al., 2020). Knowledge about temporal and spatial variability in rainfall erosivity can be enhanced using high-frequency data that can be obtained using optical disdrometers. However, such data are often lacking (Guyot et al., 2019). Such studies are lacking in regions with extreme rainfall erosivity values such as Slovenia that has one of the highest erosivity values in Europe (Panagos et al., 2015a). Rainfall erosivity is one of the important factors that affect soil erosion, which can lead to degradation of high-quality soils used in agriculture or other environmental problems (Panagos et al., 2015b; Yin et al., 2017). Various approaches can be applied for its estimation. Since high-frequency data are rarely available, a variety of methods have been developed for rainfall erosivity estimation. The most simple one uses relatively simple functions, such as a linear function, to relate rainfall erosivity to rainfall-derived variables such as mean annual rainfall or maximum daily rainfall (Petkovšek and Mikoš, 2004; Diodato and Bellocchi, 2007; Hernando and Romana, 2014, 2016). An alternative approach uses high-frequency rainfall data with rainfall most commonly measured at 5, 10, 30, and 60 min time steps (Panagos et al., 2016b). In the next step, one of the many developed equations that relate rainfall intensity (I) to rainfall kinetic energy (KE) should be applied (Petan et al., 2010; Panagos et al., 2015a, 2016b; Angulo-Martínez et al., 2016; Ballabio et al., 2017; Mineo et al., 2019). This kind of equations (i.e., I-KE) is constructed using information about rainfall KE. Since the invention of the impact-type Joss-Waldvogel disdrometer in 1967 (Joss and Waldvogel, 1967), it has been considered as a standard for raindrop size distribution measurements (Tokay et al., 2005, 2013). Nowadays, other types of disdrometers, such as 2-Dimensional Video Disdrometers or laser-optical disdrometers, can be used for detecting the number of raindrops in different classes (called bins), which are defined based on raindrop diameter and fall velocity (Tokay et al., 2013). This kind of data is also known as drop size distribution (DSD). The knowledge of rainfall DSD at the land surface is essential for understanding precipitation mechanisms affecting soil erosion processes (Serio et al., 2019). They can also be helpful in gaining knowledge about processes not directly related to erosivity, such as to interception by vegetation modeling (Zabret et al., 2017). It can also be used to calculate the rainfall KE and therefore to develop KE-I equations (Petan et al., 2010; Angulo-Martínez et al., 2016; Wilken et al., 2018).
The applications of optical disdrometers can be traced back over several decades, e.g., field measurements in Barcelona between January 1994 and December 1995 (Cerro et al., 1998). Some recent studies using the optical type of disdrometers to study DSD and estimating rainfall erosivity include, among others, a study at Palermo, Sicily, in the periods 2006–2012 (Carollo and Ferro, 2015) and 2006–2014 (Carollo et al., 2016, 2017), in the Lazio region in central Italy in the period June 2010–April 2015 (Mineo et al., 2019), in Cherrapunji in Northeast India from May to October 2017 (Murata et al., 2020), and in Central China in summer 2018 (Fu et al., 2020). Not many studies have evaluated disdrometer data not only as point measurements but rather in terms of spatial variability. Muñoz et al. (2016) applied optical disdrometers together with tipping bucket rain gauges in the Andean Cordillera to analyze the effect of the Andean altitudinal gradient on cumulative rainfall and intensities. Sanchez-Moreno et al. (2014) used optical disdrometer data and rain gauge data gathered between 2008 and 2010 at Santiago Island in Cape Verde, off the west coast of Africa, to find a strong relationship between daily, monthly, and annual rainfall erosivity and elevation. Orellana-Alvear et al. (2017) concluded that most studies in mountain regions have been carried out without fully considering rainfall spatial variability and, consequently, the effects of altitudinal gradients on rainfall characteristics. They studied tropical rainfall in the high Andes of Southern Ecuador and found out that a mean drop volume diameter varies with elevation and may account for tropical rainfall variability at high altitudes: very light rain (drizzle) is more common at higher altitudes with longer-duration events, whereas convective rainfall events are more frequent at the lower range. Ma et al. (2019) concluded there are few observations and investigations of DSD in cold, mountainous regions. They studied raindrop spectra data obtained in 2015 for the Qinghai-Tibet Plateau but have not studied any elevation gradients.
This study evaluated temporal and spatial variability in rainfall erosivity using the DSD data measured at six locations in the northern part of Slovenia (Europe). This area is characterized by Alpine climate (Dolšak et al., 2016) and some very high rainfall erosivity values, even on the European scale, can be found in this part of the country (Panagos et al., 2015a; Bezak et al., 2015b; Petek et al., 2018). One of the factors that affect the rainfall KE and consequently erosivity is altitude (Mikhailova et al., 1997; Hoyos et al., 2005; Nel and Sumner, 2007; Nel et al., 2010; Nearing et al., 2015; Montero-Martínez et al., 2020). Generally, one can expect that, in smaller mountainous areas, rainfall erosivity increases with altitude (Hoyos et al., 2005; Nearing et al., 2015). Consequently, the dependence between annual rainfall and annual erosivity can be relatively strong (Nearing et al., 2015). The reason for higher KE at higher elevations can be the increase in raindrop fall velocity due to the air density-altitude relationship (Montero-Martínez et al., 2020). Local weather patterns can also affect the rainfall erosivity-altitude relationship (Hoyos et al., 2005). However, in larger areas such as on the continental scale, there are many other factors that affect rainfall erosivity and consequently, no significant dependence between erosivity and altitude can be found (Panagos et al., 2015a). Moreover, at several investigated locations, researchers have found that rainfall erosivity is decreasing with increasing elevation (Mikhailova et al., 1997; Nel and Sumner, 2007; Nel et al., 2010). Mikhailova et al. (1997) argued that, at higher elevations, more small drops and less large drops can be detected due to the absence of pronounced accretion and less significant raindrop coalescence, leading to lower erosivity. This impact could overcome the effect of decreased air density on fall velocity and could lead to a decrease of KE with elevation (Mikhailova et al., 1997). Furthermore, in some cases, a rainfall erosivity decrease with altitude was related to reduced maximum intensities of erosive events and fewer high-intensity events, which resulted in smaller rainfall erosivity at higher locations (Nel and Sumner, 2007). Rainfall erosivity is also characterized by large spatial and temporal variability (Hoyos et al., 2005; Meusburger et al., 2012; Ballabio et al., 2017; Petek et al., 2018).
The main aim of this study was to evaluate the spatial and temporal variability of rainfall erosivity for the selected Slovenian meteorological stations, which are located in an Alpine climate zone, and to investigate the possible causes for some very high rainfall erosivity values measured in the past. For this purpose, 1 min DSD data measured using optical disdrometers and 5 min precipitation data measured using pluviographs from six locations in Slovenia were used. Elevation of these meteorological stations, located in the mountainous part of Slovenia, ranged from around 400 m a.s.l. to about 1,500 m a.s.l. Moreover, stations with annual rainfall erosivity ranging up to 10,000 MJ mm ha−1 h−1 were included in this study. This enabled us to investigate the possible elevation effect on rainfall erosivity for a range of rainfall events with different erosivity values. Since rainfall erosivity is one of soil erosion drivers, the results of this study could help to understand the uncertainties related to rainfall erosivity estimation due to the nonavailability of high-frequency data or due to the limited number of stations at high altitudes.
Methodology
Data
In order to evaluate spatial and temporal variability in rainfall erosivity, six meteorological stations located in the northern part of Slovenia were selected (Figure 1), belonging to the national observational meteorological network developed and maintained by the Slovenian Environment Agency (ARSO). Kneške Ravne station is located on the hillslopes of the Julian Alps, just below a major orographic barrier, positioned perpendicular to the dominant direction (from SW toward NE) of the wet air masses flow (Krklec et al., 2018; Rusjan et al., 2019). A few kilometers northwards, the Vogel station is situated on a windy plateau. Korensko sedlo station is located in the far NW corner of Slovenia, on a mountain pass close to the Slovenian-Austrian border. Downstream the Sava River, a large urban area is found in the valley where Kranj station is located among buildings. Pohorje is a mountain range in NE Slovenia where Rogla station is positioned on one of its domed summits, while Hočko Pohorje station is found on its eastern hillslopes. Table 1 shows the main characteristics of the selected stations.
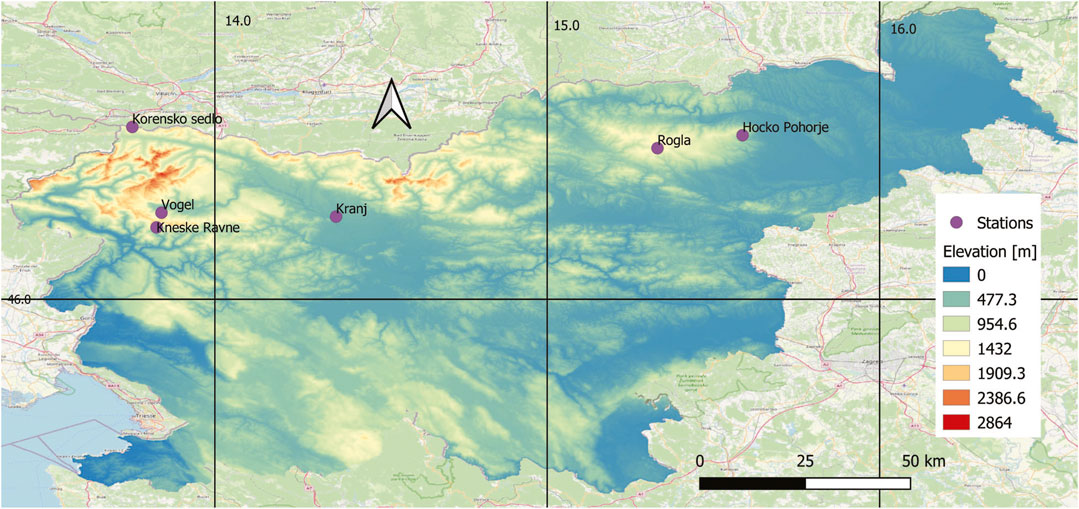
FIGURE 1. Location of six selected meteorological stations on the topography map of Slovenia (red: higher elevation; green: lower elevation, 0–2,864 m a.s.l.).
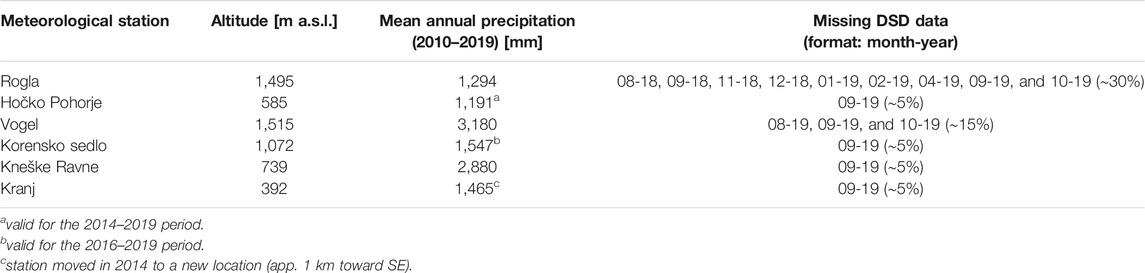
TABLE 1. Main characteristics of the analyzed meteorological stations. DSD stands for drop size distribution.
The stations can be geographically grouped into two subgroups: Korensko sedlo, Vogel, Kneške Ravne, and Kranj are part of group 1 (Figure 2) and Rogla and Hočko Pohorje are part of group 2 (Figure 3). The distance between Rogla and Hočko Pohorje stations is around 20 km, while the other four stations cover an area of around 750 km2. Korensko sedlo, Vogel, Kneške Ravne, and Rogla stations are positioned in Alpine climate (Dolšak et al., 2016) and are also located at a higher elevation. On the other hand, Kranj and Hočko Pohorje stations are located at a lower elevation and are impacted by a mix of Alpine and temperate continental climates. In Slovenia, three climate types are present: Alpine, temperate continental, and Mediterranean (Dolšak et al., 2016).
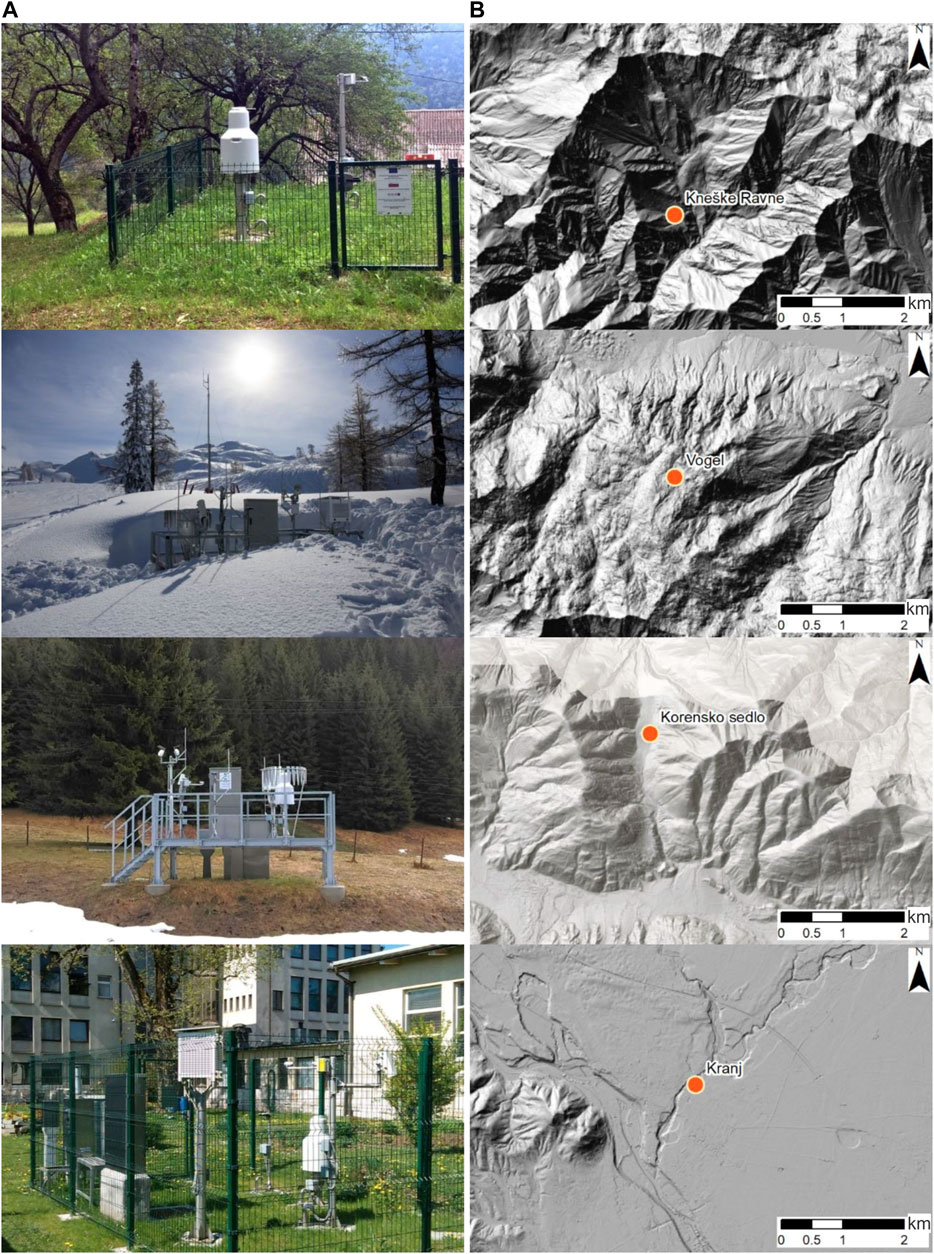
FIGURE 2. Photos of Kneške Ravne, Vogel, Korensko sedlo, and Kranj meteorological stations (A) and their location on a hillshade map (B). Hillshade source: Lidar Hillshade (http://gis.arso.gov.si/arcgis/rest/services/Lidar_hillshade/MapServer/WMTS) and Elevation/World_Hillshade (http://services.arcgisonline.com/arcgis/services).
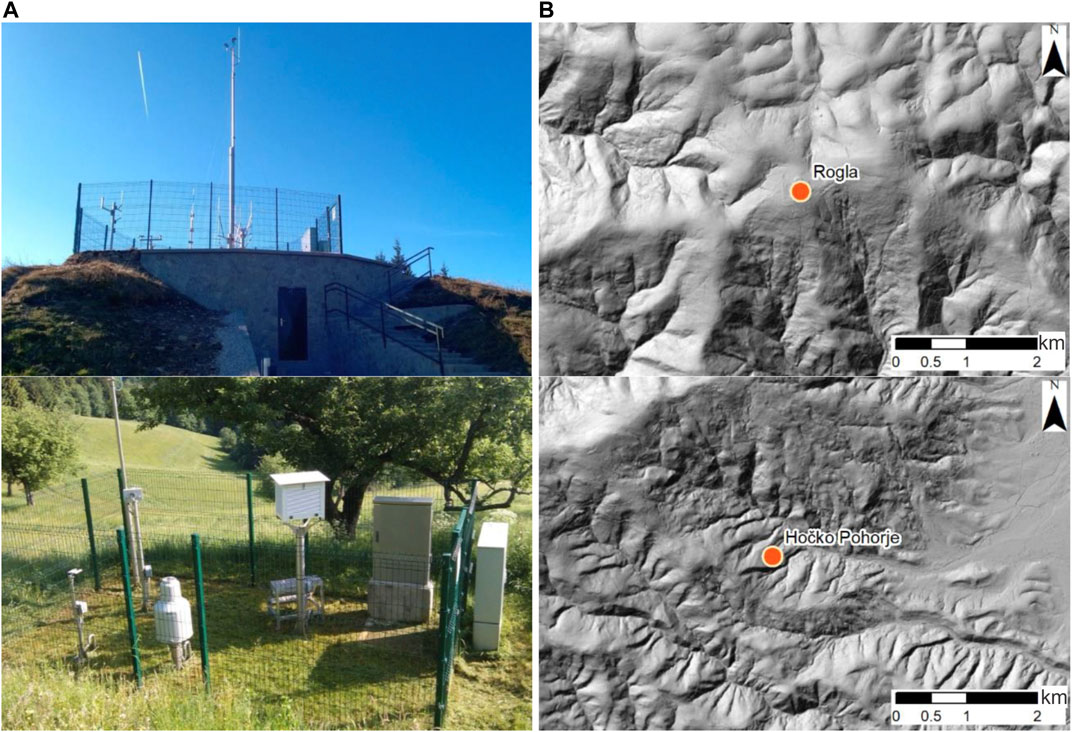
FIGURE 3. Photos of Rogla and Hočko Pohorje meteorological stations (A) and their location on a hillshade map (B). Hillshade source: Lidar Hillshade (http://gis.arso.gov.si/arcgis/rest/services/Lidar_hillshade/MapServer/WMTS).
In this study, the data from July 2018 until August 2020 were used. All six stations are equipped with Thies Clima optical disdrometers (Thies Clima: Laser Precipitation Monitor, 2020) and OTT pluviographs (OTT Pluvio, 2020). This means that 1 min DSD data measured using disdrometers and 5 min rainfall data measured using pluviographs were available for all locations. Missing DSD data are indicated in Table 1. It should be noted that pluviographs also had some missing data (i.e., less than 2%); however, these periods were of shorter duration and are therefore not indicated in Table 1. The measuring area of the disdrometers is 45.6 cm2. The Thies Clima disdrometer has 22 drop size classes (from 0.16 to 8 mm) and 20 velocity classes (from 0.2 to 20 m/s) and it measures rainfall intensities from 0.005 to above 250 mm/h (Thies Clima: Laser Precipitation Monitor, 2020). The measurement quality is in the range of 15% for intensities between 0.5 and 20 mm/h (Thies Clima: Laser Precipitation Monitor, 2020). Some past studies already evaluated the performance of the Thies Clima disdrometers (Frasson et al., 2011; Angulo-Martínez et al., 2018; Johannsen et al., 2020b). The pluviograph measuring area is 200 cm2, and it has a resolution of 0.01 mm/h and an accuracy of 1% (OTT Pluvio, 2020). Vogel and Rogla stations also have wind speed measurements available. Therefore, for these two stations, we also used 10 min wind speed measurements for the investigated period with the aim of investigating the possible wind effects on the DSD data and rainfall erosivity.
Methods
Slovenian Stations in the Rainfall Erosivity Database on the European Scale
As background information for this study, we firstly checked the dependence between the annual rainfall erosivity, altitude, and long-term mean annual precipitation for the Slovenian stations included in the Rainfall Erosivity Database on the European Scale (REDES), which is used for constructing the rainfall erosivity map of Europe (Panagos et al., 2015a, 2016b; Ballabio et al., 2017; Bezak et al., 2020). 31 Slovenian stations quite uniformly distributed across the country are included in the REDES database and the period from 1999 until 2008 was used for the mean annual rainfall erosivity calculation. Among the 31 stations included in REDES database, Kneške Ravne and Vogel stations are included in this study. 5 min data measured by pluviographs (i.e., no DSD data is available) were used as an input in the REDES database (Panagos et al., 2015a). The idea behind using these data was to see if there is a clear altitude effect evident when using the Slovenian stations from the REDES database.
Optical Disdrometers
In order to calculate the KE based on the disdrometer DSD data, the following equation was used for every data interval
where
where notations used are the same as those in Equation 1. Similar to Petan et al. (2010), we only considered raindrops with a diameter smaller than 7 mm in order to exclude cases where two or more raindrops fall through the detection area simultaneously. When investigating the KE-I relationship, we only considered 1 min values where rainfall intensity was larger than 0.1 mm/h. Scatter plots were used for data visualization.
Some of the analyses (i.e., investigation of raindrop characteristics for various intensities) also focused on raindrop diameters up to 3 mm. Diameter classes determined using the disdrometer software from 1 to 11 with a mean diameter of drop size classes of 0.1875, 0.3125, 0.4375, 0.625, 0.875, 1.125, 1.375, 1.625, 1.875, 2.25, and 2.75 mm were considered (Thies Clima: Laser Precipitation Monitor, 2020). The standard calendar quarters January–March, April–June, July–September, and October–December were defined as winter, spring, summer, and autumn, respectively. Additionally, the KE-I equation, which was developed by Petan (2010) for the Bovec station, located in the Alpine climate in the Soča river basin (with some Mediterranean effects present), was used:
where e is specific KE [MJ ha−1 mm−1]. The equation is valid in the range between 0.1 and 250 mm/h (Petan, 2010). In order to derive rainfall erosivity, the erosive events were determined according to the RUSLE methodology (Wischmeier and Smith, 1978; Renard et al., 1997). This means that two events were separated in case of 6 h interval with less than 1.27 mm of rain and similarly as Petan et al. (2010), we considered events with more than 6 mm of rain instead of 12.7 mm with the aim of increasing the number of rainfall erosive events. For example, Petek et al. (2018) found that consideration of all rainfall events and not just the erosive ones (i.e., more than 12.7 mm of rain) increased the annual rainfall erosivity up to 10%. For the calculation of the event rainfall erosivity R, the total KE of the erosive event was multiplied with the maximum 30 min intensity of the event.
In order to investigate the variability among stations, we also carried out a detailed investigation of a few selected rainfall events using heatmap plots.
Pluviographs
Event rainfall erosivity was also calculated using 5 min rainfall data measured using pluviographs. Again, RUSLE methodology was used for event separation (Wischmeier and Smith, 1978; Renard et al., 1997). Two KE-I equations were tested (Brown and Foster, 1987; Petan, 2010):
In the first step, all erosive events were identified, while in the second step, the KE of the erosive event was calculated, and finally, the event rainfall erosivity was derived after multiplying the KE with the maximum 30 min intensity. A comparison between the rainfall erosivity calculated using disdrometer and pluviograph data was made using scatter plots.
Results and Discussion
Slovenian Stations in the REDES Database
Figure 4 shows the relationship between erosivity, altitude, and long-term mean annual precipitation. Linear trend lines are also shown. One can notice that R2 (i.e., coefficient of determination) between erosivity and long-term mean annual precipitation is higher than the coefficient of determination between erosivity and altitude (Figure 4). This means that altitude is not a very good predictor of erosivity in the case of Slovenia. The main reason is probably the relatively complex topography and rainfall generation mechanisms that often lead to flash floods or rainfall-induced landslide triggering (Mikoš et al., 2006; Rusjan et al., 2009; Bezak et al., 2015a; Jemec Auflič et al., 2017; Mikoš, 2020b, 2020a, 2021).
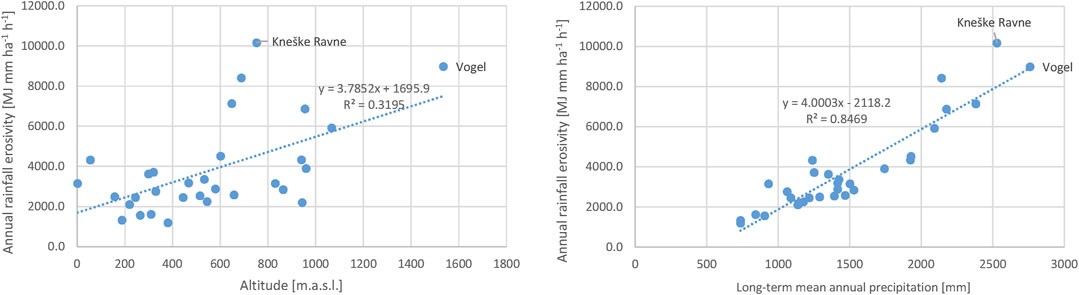
FIGURE 4. Relationship between annual rainfall erosivity, altitude, and long-term mean annual precipitation (1999–2018) for the 31 Slovenian stations included in the REDES database. The names of the two stations that were also used in this study are written.
Long-term mean annual precipitation in Slovenia decreases from west to east where maximum values can exceed 3,000 mm and minimum values are around 900 mm (de Luis et al., 2014). The dominant direction of wet air masses in Slovenia is from southwest to northeast (Rusjan et al., 2019). However, relatively large variability in wet air masses direction in different seasons can be seen in Slovenia (Krklec et al., 2018), which also impacts the local rainfall erosivity rates. Therefore, one could argue that, in some cases, the impact of local orographic and climatological conditions on rainfall erosivity prevails over the air density-altitude relationship impact. Therefore, as one can see from Figure 4 that there are several meteorological stations that are located at similar altitudes (e.g., check stations around 900 m a.s.l.) but are characterized by annual rainfall erosivity ranging from 2,000 to 7,000 MJ mm ha−1 h−1. However, long-term mean annual precipitation shows a stronger dependence on erosivity (Figure 4). No dependence between station altitude and rainfall erosivity can be found if one considers all 1,675 stations included in the REDES, which cover almost entire Europe (Panagos et al., 2015a; Bezak et al., 2020). Thus, it seems that long-term mean annual precipitation is a better rainfall erosivity predictor than the meteorological station elevation.
One-Minute Rainfall Measurements
Figure 5 shows the KE-I relationship between six analyzed stations calculated using Equations 1, 2 for the 1 min DSD data. One can notice that, for all six stations, the Bovec equation slightly overestimates KE for rainfall intensities larger than 5 mm/h (Figure 5). A similar phenomenon was observed by Wilken et al. (2018) who tested more than 30 different KE-I equations and observed different types of overestimation such as exponential (i.e., increasing) or constant. Other researchers have obtained similar results (Angulo-Martínez et al., 2016). Some equations in some cases also underestimated KE, while most of equations overestimated it; overestimation also occurred on the annual level (Wilken et al., 2018). Compared to Wilken et al. (2018), a larger percentage of data was needed to achieve 90% of the total KE. More specifically, 34, 33, 37, 34, 32, and 33% of the total rainfall minutes were needed to account for the 90% KE for the Kneške Ravne, Hočko Pohorje, Korensko sedlo, Kranj, Vogel, and Rogla stations, respectively. A similar pattern can also be seen for the KE-I relationship shown in Figure 5, where all stations show a similar structure of KE and I (a similar type of overestimation by the Bovec function). There are some differences in the maximum KE values found at different stations, whereas maximum values are obtained for the Vogel station. However, for all stations, only a few points exceed 3,000 J m−2 h−1. Thus, no clear effect of elevation can be seen based on the plots shown in Figure 5 and based on the percent of data needed to account for 90% of the total KE compared to some other studies (Montero-Martínez et al., 2020). It seems that local conditions prevail in the case of the analyzed stations (Figures 2, 3), at least when one investigates all KE-I values detected by the optical disdrometer. Furthermore, comparing seasonal characteristics under the Alpine climate, it can be seen that maximum 1 min values are usually observed in summer, followed by autumn and spring. On the other hand, the lowest KE values are observed in winter.
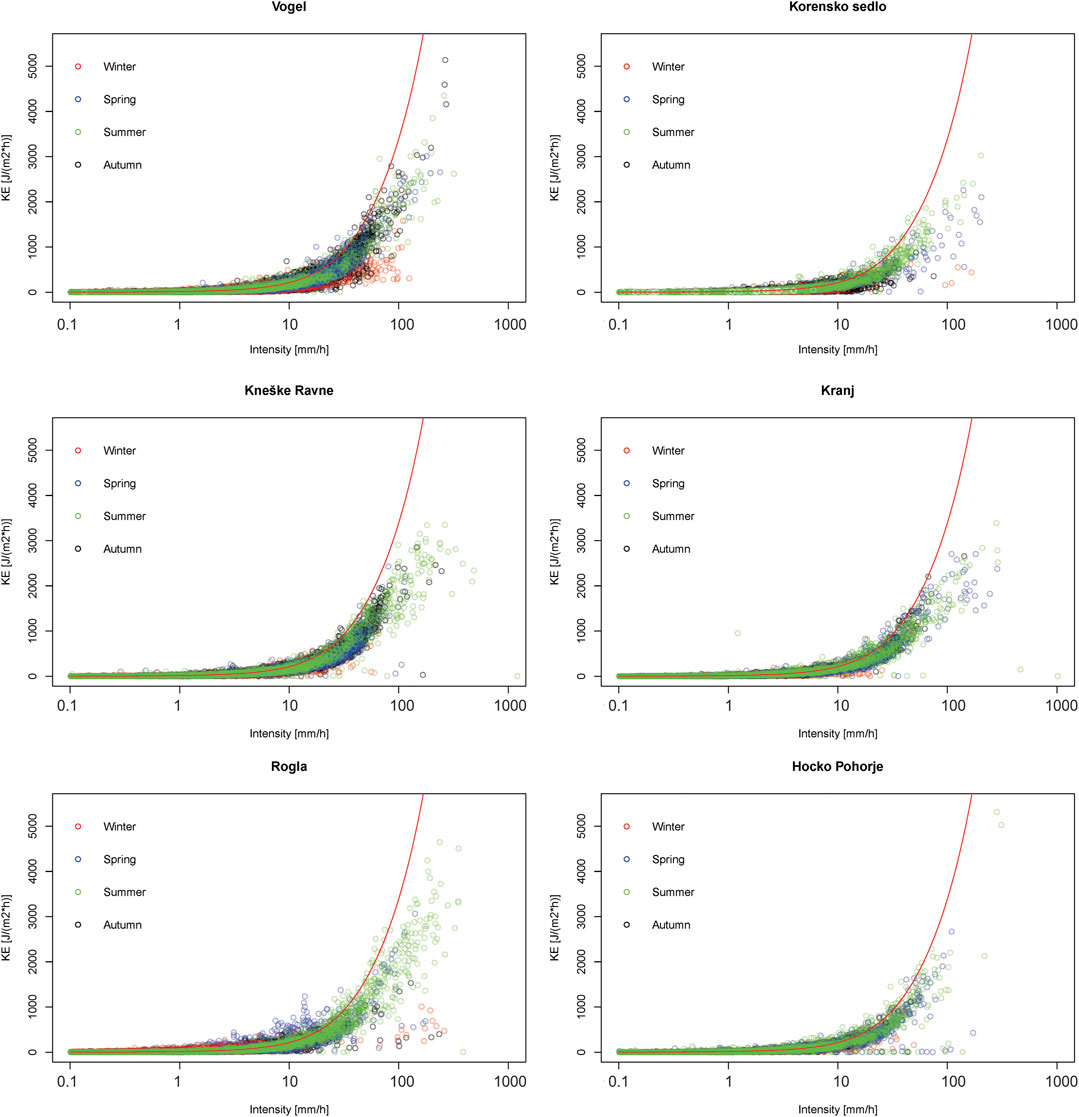
FIGURE 5. 1 min KE-I relationship for six analyzed stations together with the KE-I function developed by Petan (2010) for Bovec station (i.e., red line).
We also calculated the percentage of raindrops in different diameter classes (Figure 6). Only the first 11 diameter classes are shown, which corresponds to the raindrop diameter smaller than 3 mm (Thies Clima: Laser Precipitation Monitor, 2020). The data were divided into subgroups based on the rainfall intensity. The number of 1 min values in a specific intensity interval is also shown (i.e., n in top right corner). It should be noted that some stations have a larger percentage of missing data, which also affects the number of all 1 min values with a rainfall intensity larger than 0.1 mm/h (Table 1). Therefore, a direct comparison of the number of 1 min values in different classes is not straightforward but one can compare the percentage of 1 min values in different rainfall intensity classes. Vogel and Kneške Ravne stations that are characterized by large rainfall erosivity have around 70% of 1 min values in the lowest intensity class (I is between 1 and 5 mm/h). On the other hand, Kranj and Korensko sedlo stations that have a lower erosivity have around 83% of 1 min values in the lowest intensity class. These two stations have in the second class around 15% of 1 min values while Vogel and Kneške Ravne stations have in this class around 28% of 1 min values. Moreover, a slightly larger percentage of 1 min values was also obtained in the third class (i.e., I between 20 and 50 mm/h) for Vogel and Kneške Ravne stations compared to Kranj and Korensko sedlo stations. It should be noted that 5 mm/h can in some cases already trigger erosion processes (Mohr et al., 2013) while the duration of rainfall events could be important for the sediment yield and runoff rates (Almeida et al., 2021). A similar relationship can also be seen for the Rogla and Hočko Pohorje stations where Rogla has more 1 min values in classes 2, 3, and 4 compared to Hočko Pohorje, which is located at a lower elevation. If we observe the absolute number of 1 min values shown in Figure 6, then one can see that this is, as expected, related to the long-term mean annual precipitation (Table 1). Thus, the highest number of 1 min values is characteristic of Vogel and Kneške Ravne stations that also have larger long-term mean annual precipitation. Therefore, the main reason for higher erosivity values for Kneške Ravne, Vogel, and Rogla stations lies in the fact that these locations generally receive more rainfall and have a larger time-share with higher rainfall intensity. Moreover, lower intensity values for the Korensko sedlo station compared to the Kneške Ravne station can mainly be explained with its location and dominant direction of wet air masses (Krklec et al., 2018; Rusjan et al., 2019). Namely, the Kneške Ravne station is located at the foot of a high mountain range, while Korensko sedlo is positioned between high mountains and behind an orographic barrier.
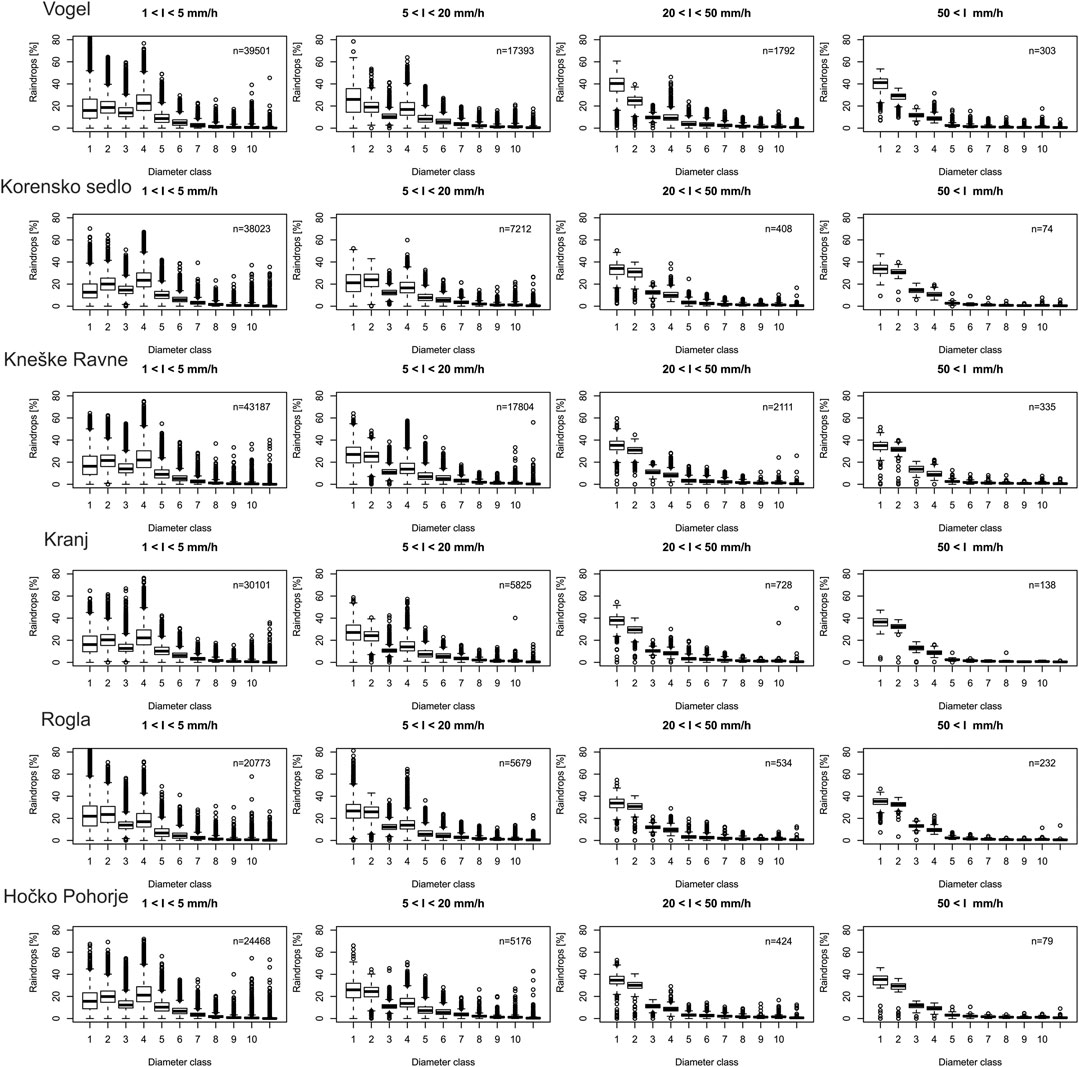
FIGURE 6. Boxplots of the percentage of the DSD data in the first 11 raindrop diameter classes for various rainfall intensities for analyzed stations. The mean diameter of drop size classes is shown in Optical Disdrometers section for the first 11 classes.
The median percentage of raindrops in diameter classes 1 and 2 (i.e., mean diameter of drop size classes is 0.1875 and 0.3125 mm, respectively) is increasing with rainfall intensity, while for diameter classes larger than 4 (i.e., raindrops larger than 0.625 mm), this percentage is decreasing with increasing rainfall intensity (Figure 6). This kind of behavior can be seen for all six analyzed stations. Similar characteristics of raindrops were also reported by Wilken et al. (2018). However, optical disdrometers have several potential detection issues, such as splashing or uneven power distribution across the laser beam (Angulo-Martínez et al., 2018). Notably, the absolute number of detected raindrops in different diameter classes is increasing with intensity, which is an expected result (Raupach and Berne, 2015), but the increase is also large in case of small drops.
As an example, we present two rainfall events that occurred at Rogla and Hočko Pohorje stations (Figure 7). Basic information about the selected events is shown in Table 2. In the second event, maximum intensities were measured shortly after the start of the event, where also multiple raindrops were detected in the largest diameter classes. Thus, this means that some raindrops had a diameter up to almost 7 mm. Therefore, the July 12, 2019, event had more raindrops in all diameter classes, while the increase was also relatively big in the number of small drops (Figure 7). As an example of the elevation effect, Figure 7 also shows disdrometer measurements during the selected two events (Table 2). In both cases, the higher elevation station (i.e., Rogla) had more rainfall, higher intensities, more detected raindrops (Table 2), higher KE, and consequently higher rainfall erosivity. The July 12, 2019, event was a typical summer thunderstorm that was very localized (ARSO, 2019a) and where the elevation effect was very explicit. The June 22, 2019, event was of longer duration, less intense, and a consequence of a frontal system (ARSO, 2019b). Therefore, the elevation effect in case of this event was smaller. Furthermore, it should be noted that, at higher altitudes, different patterns can be observed and higher elevations can be characterized by more frequent light rain, while at a lower location, convective events can be more frequent as is the case of Andes (Orellana-Alvear et al., 2017). Moreover, a recent study that investigated the rainfall erosivity synchrony scale at the pan-European scale (Bezak et al., 2021a) indicated that the synchrony scale is the smallest in Alpine regions. Thus, in this area, the rainfall events are the most localized.
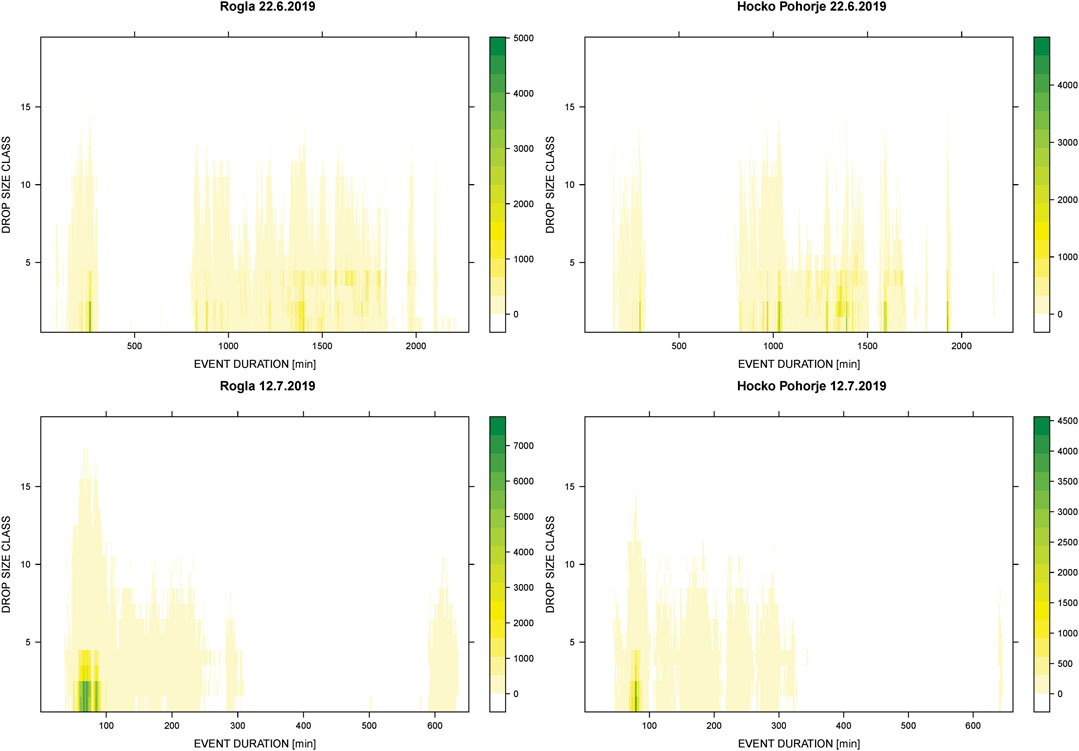
FIGURE 7. Two rainfall events with different characteristics that occurred at Rogla and Hočko Pohorje stations. The first event started on June 22, 2019, at 9:00 and the second event on July 12, 2019, at 17:00. The x-axis shows event duration in minutes, the y-axis shows 19 diameter classes, and the color scale indicates the number of detected raindrops per diameter class during the event.
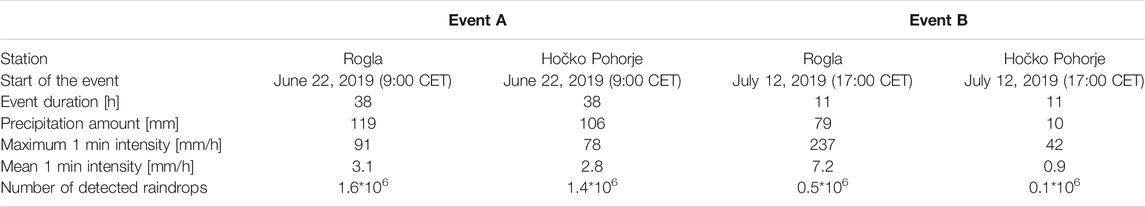
TABLE 2. Main characteristics of the selected two events at Rogla and Hočko Pohorje stations.
Erosive Events
In the next step, we also computed rainfall erosivity of all erosive events using 1 min disdrometer data and also 5 min Pluvio data. Figure 8 shows the boxplots of rainfall erosivity for all erosive events that were determined using optical disdrometer data where KE was determined using DSD data. One can notice that Rogla, Vogel, and Kneške Ravne stations have larger erosivity values than the other three analyzed stations. The most extreme events had rainfall erosivity around 2,000 MJ mm ha−1 h−1. For the Korensko sedlo and Hočko Pohorje, the extreme values were up to 500 MJ mm ha−1 h−1. If one compares the median values of the erosive events shown in Figure 8, we can see that the highest value is characteristic of Vogel and Kneške Ravne stations, followed by the Rogla station. While the other three stations have similar median erosivity values of all erosive events (Figure 8). It seems that the large percentage of higher intensity 1 min values (i.e., above 5 mm/h) also leads to larger erosivity in the case of the aforementioned stations (i.e., Rogla, Vogel, and Kneške Ravne). Figure 9 shows a comparison between event-based rainfall erosivity using 1 min optical disdrometer data and 5 min pluviograph data. Comparison between event-based rainfall sum for both measuring sensors is also shown (Figure 9). Equations 4, 5 were used for calculating the KE in case of pluviograph data, while DSD data were used in case of disdrometer data. Generally, the optical disdrometer compared to the pluviographs can overestimate the total rainfall. Similar results were also obtained in some other studies (Lanza and Vuerich, 2009, 2012; Petan et al., 2010; Montero-Martínez et al., 2016). Lanza and Vuerich (2012) found that the optical disdrometer can overestimate rainfall intensities in the range of up to 50%. In our study, the optical disdrometer mostly overestimated the total rainfall, also in the range up to 30%, while the mean overestimation was approximately around 5% (Figure 9). Moreover, for the Rogla station, the overestimation was even more explicit (i.e., around 30%). Using the 10 min wind measurements available for the Rogla and Vogel stations, we also investigated the differences in the wind speed measurements. The comparison of the measured data shows that, in both cases, there are some dominant wind directions (not shown here). Based on the results presented in Figure 10, one can also notice that, for rainfall intensities up to 10 mm/h (i.e., 3–10 mm/h), the corresponding average wind speed for Rogla (i.e., 4.7 m/s) is larger than for the Vogel station (i.e., 2.3 m/s). Although it is true that the number of points on Figure 10 is around three times larger for Vogel station than for Rogla station, while for intensities, it is larger than 10 mm/h, this difference between stations is smaller, for Vogel and Rogla 2.8 and 3.9 m/s, respectively. Therefore, the reason for the previously mentioned overestimation could indeed be the microlocation of the Rogla station and the wind effect (Michaelides et al., 2009). In terms of overestimation, the Rogla station was followed by Kneške Ravne station where the overestimation of the total rainfall was around 17%, while for other stations, the overestimation was smaller than 10%. Furthermore, some studies also found that disdrometer measurements underestimate rainfall (Johannsen et al., 2020a). Similarly, in the majority of cases, the optical disdrometer yielded larger rainfall erosivity estimates compared to pluviograph values (Figure 9). This applies especially to the Brown and Foster KE-I equation. For the Bovec KE-I equation, higher values were obtained in case of Pluvio data for the Kneške Ravne, Hočko Pohorje, Kranj, Vogel, and also Korensko sedlo stations. Angulo-Martínez et al. (2016) pointed out that, on the event scale, there was a better agreement between observed and theoretical erosivity values as in the case of 1 min data. Similar conclusions can also be made based on the results presented in this study. Analysis of the event-based data confirms the findings made using 1 min data; i.e., there is no clear effect of altitude in case of selected stations and other local climatological conditions have an important impact on the rainfall erosivity.
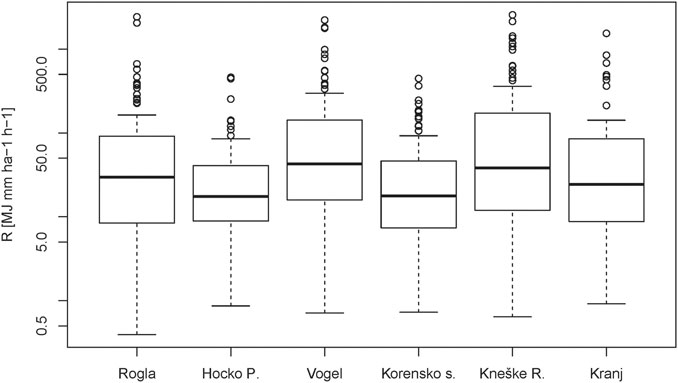
FIGURE 8. Boxplots of all erosive events for the analyzed stations, where rainfall erosivity was calculated using 1 min optical disdrometer data.
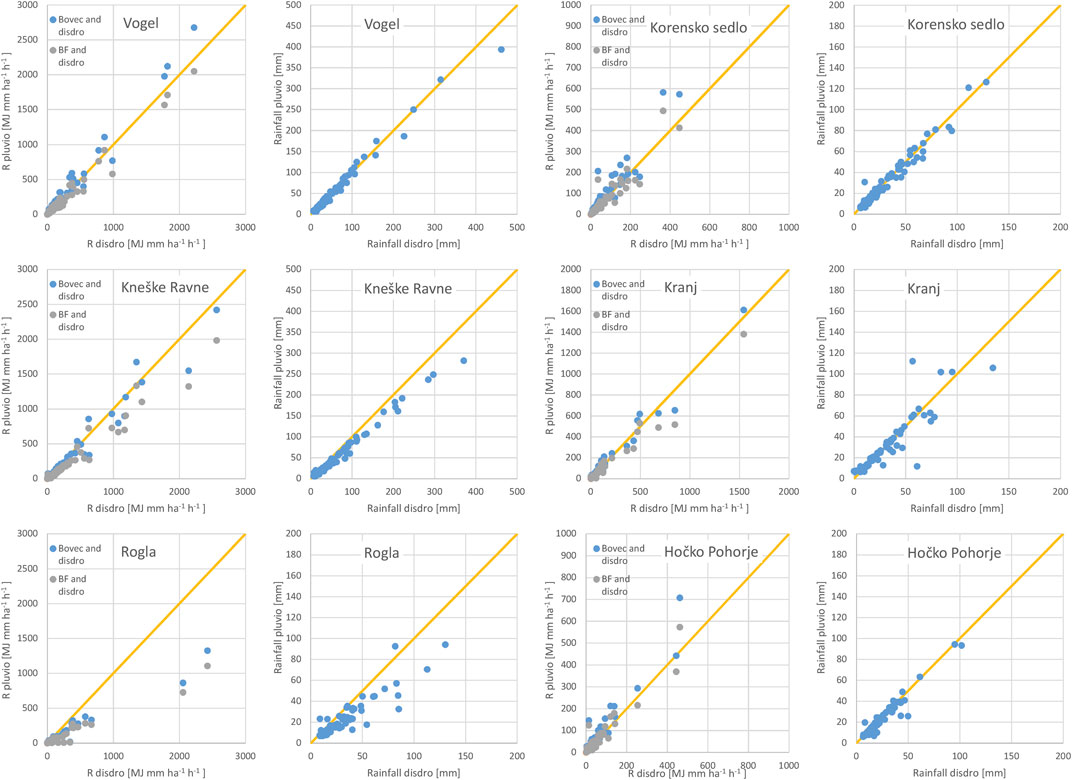
FIGURE 9. Comparison between rainfall erosivity determined using 1 min optical disdrometer data and 5 min pluviographs data, where Equations 4, 5 were used. Comparison between the event rainfall sum is also shown.
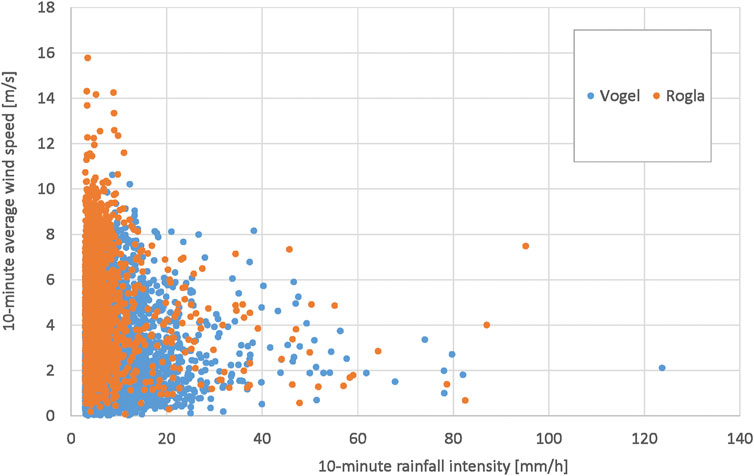
FIGURE 10. Relationship between 10 min wind speed and rainfall intensity for Vogel and Rogla stations that have wind speed measurements available. Only intensities larger than 3 mm/h are shown.
Study Limitations
There are several limitations related to this study under the Alpine climate in Slovenia that could affect the presented results. Firstly, two years of high-frequency data with a 1 min time step is not enough to obtain robust conclusions regarding the temporal variability as indeed year-by-year variability can be quite significant. Extreme events tend to occur less frequently compared to moderate or low magnitude erosive events. A recent study has indicated that the largest interannual inequality of rainfall erosive events in Europe was observed in the Alpine region (Bezak et al., 2021c) and this region was also associated with smaller synchrony scale values (Bezak et al., 2021a). Longer data series are needed to obtain additional insight into temporal variability. To this end, data collection at the selected stations in Slovenia will continue and similar investigations will be performed in the future. Secondly, if spatial data density was higher, with no orographic barriers positioned among the stations, probably a more significant altitude effect could be detected, particularly if additional stations would be positioned between Rogla and Hočko Pohorje stations. However, the network density is determined by the Slovenian Environment Agency, which is also the data provider, and it is very unlikely that density will increase in the future. Therefore, a specific experimental design has to be set up (e.g., Orellana-Alvear et al., 2017) in order to obtain better knowledge about the altitude effect. This could be done in the scope of the work performed at experimental catchments in Slovenia (Sapač et al., 2021). Thirdly, also local conditions (e.g., strong wind) can affect the accuracy of measurements conducted by the optical disdrometers. It should be noted that both Rogla station and Vogel station had a percentage of missing values above 10%, which could also affect the results.
Conclusion
Within this study, spatial and temporal variability of rainfall erosivity was evaluated using a two-year-long dataset of optical disdrometer DSD and pluviograph rainfall intensity measurements at six meteorological stations located at various altitudes in Slovenia. The erosive events, their KE, and rainfall erosivity were determined according to the RUSLE methodology. The analysis showed that there is no clear altitude effect on rainfall erosivity. Moreover, it was found that long-term mean annual precipitation is a better rainfall erosivity predictor since higher erosivity values were obtained for the locations where more rainfall is detected (e.g., Kneške Ravne, Vogel, and Rogla stations). Both findings also apply to the Slovene stations included in the REDES database. The altitude effect is more pronounced in case of short-term thunderstorms and it could be detected if the measuring stations are located close enough (e.g., Rogla and Hočko Pohorje stations). Thus, to capture the altitude effect, additional measuring stations should be set up near major orographic barriers at relatively small distances.
A good agreement between disdrometer and pluviograph rainfall intensity measurements was obtained on most of the stations. However, in some cases, relatively large differences were detected. The main reason could be attributed to the station microlocation and the wind effect (e.g., Rogla station). In such cases, care should be taken while calculating rainfall erosivity from 5 min pluviograph data. These results also influence the soil erosion calculation using the RUSLE type of models. It was found that approximately 35% of all 1 min rainfall intensities are needed to account for 90% of the total KE. Moreover, the local KE-I equation developed for Bovec station yielded a reasonably good fit to the measured KE-I data despite the slight overestimation noticed at higher rainfall intensities for all investigated stations.
The highest rainfall erosivity values were measured in summer followed by autumn and spring at all six stations. Notably, an extreme rainfall erosivity event can occur in any of the four seasons. Some very high rainfall erosivity values detected at the stations in the Alpine environment, which could be regarded as very high even at European scale, could be explained by a larger percentage of 1 min rainfall intensities above 5 mm/h (e.g., Kneške Ravne and Vogel stations). Therefore, the most extreme events can contribute a large percentage of the total rainfall erosivity. Such characteristics and possible spatial and temporal changes should be additionally explored at larger scales, such as the European scale using the REDES dataset. The data collection on the Slovenian measuring sites will continue in the future to enhance the knowledge about the rainfall erosivity in regions with very high erosivity, as presented in this manuscript, as the presented conclusions can also be important from the soil erosion perspective (e.g., modeling, prevention, and forecasting). Therefore, the presented results should be regarded as preliminary results that could be validated in the future by using longer time series.
Data Availability Statement
The data analyzed in this study are subject to the following licenses/restrictions. Data are owned by the Slovenian Research Agency but can be obtained for research purposes free of charge. Requests to access these datasets should be directed to gp.arso@gov.si.
Author Contributions
All three authors conceptualized the study, NB performed most of the investigations and prepared the first draft, and SP and MM revised and commented on the manuscript.
Funding
The authors acknowledge the financial support from the Slovenian Research Agency (ARRS) (research core funding No. P2-0180). The conducted research is also in the scope of the UNESCO Chair on Water-Related Disaster Risk Reduction at the University of Ljubljana.
Conflict of Interest
The authors declare that the research was conducted in the absence of any commercial or financial relationships that could be construed as a potential conflict of interest.
Publisher’s Note
All claims expressed in this article are solely those of the authors and do not necessarily represent those of their affiliated organizations or those of the publisher, the editors, and the reviewers. Any product that may be evaluated in this article or claim that may be made by its manufacturer is not guaranteed or endorsed by the publisher.
Acknowledgments
The critical and useful comments of the two reviewers greatly improved this work. The authors would like to acknowledge M. Vilfan’s support with English editing.
References
Almeida, W. S. D., Seitz, S., Oliveira, L. F. C. D., and Carvalho, D. F. D. (2021). Duration and Intensity of Rainfall Events with the Same Erosivity Change Sediment Yield and Runoff Rates. Int. Soil Water Conserv. Res. 9, 69–75. doi:10.1016/j.iswcr.2020.10.004
Angulo-Martínez, M., Beguería, S., and Kyselý, J. (2016). Use of Disdrometer Data to Evaluate the Relationship of Rainfall Kinetic Energy and Intensity (KE-I). Sci. Total Environ. 568, 83–94. doi:10.1016/j.scitotenv.2016.05.223
Angulo-Martínez, M., Beguería, S., Latorre, B., and Fernández-Raga, M. (2018). Comparison of Precipitation Measurements by OTT Parsivel2 and Thies LPM Optical Disdrometers. Hydrol. Earth Syst. Sci. 22, 2811–2837. doi:10.5194/hess-22-2811-2018
ARSO (2019a). Event 12-13 July. Available at: http://meteo.arso.gov.si/uploads/probase/www/climate/text/sl/weather_events/neurja_12-13jul2019.pdf (Accessed June 15, 2021).
ARSO (2019b). Event 19-23 June. Available at: http://meteo.arso.gov.si/uploads/probase/www/climate/text/sl/weather_events/neurja_19-23jun2019.pdf (Accessed June 15, 2021).
Ballabio, C., Borrelli, P., Spinoni, J., Meusburger, K., Michaelides, S., Beguería, S., et al. (2017). Mapping Monthly Rainfall Erosivity in Europe. Sci. Total Environ. 579, 1298–1315. doi:10.1016/J.SCITOTENV.2016.11.123
Bezak, N., Grigillo, D., Urbančič, T., Mikoš, M., Petrovič, D., and Rusjan, S. (2017a). Geomorphic Response Detection and Quantification in a Steep Forested Torrent. Geomorphology 291, 33–44. doi:10.1016/j.geomorph.2016.06.034
Bezak, N., Rusjan, S., Petan, S., Sodnik, J., and Mikoš, M. (2015b). Estimation of Soil Loss by the WATEM/SEDEM Model Using an Automatic Parameter Estimation Procedure. Environ. Earth Sci. 74, 5245–5261. doi:10.1007/s12665-015-4534-0
Bezak, N., Ballabio, C., Mikoš, M., Petan, S., Borrelli, P., and Panagos, P. (2020). Reconstruction of Past Rainfall Erosivity and Trend Detection Based on the REDES Database and Reanalysis Rainfall. J. Hydrol. 590, 125372. doi:10.1016/j.jhydrol.2020.125372
Bezak, N., Borrelli, P., and Panagos, P. (2021a). A First Assessment of Rainfall Erosivity Synchrony Scale at Pan-European Scale. Catena 198, 105060. doi:10.1016/j.catena.2020.105060
Bezak, N., Mikoš, M., Borrelli, P., Alewell, C., Alvarez, P., Anache, J. A. A., et al. (2021b). Soil Erosion Modelling: A Bibliometric Analysis. Environ. Res. 197, 111087. doi:10.1016/j.envres.2021.111087
Bezak, N., Mikoš, M., Borrelli, P., Liakos, L., and Panagos, P. (2021c). An In-Depth Statistical Analysis of the Rainstorms Erosivity in Europe. Catena 206, 105577. doi:10.1016/j.catena.2021.105577
Borrelli, P., Alewell, C., Alvarez, P., Anache, J. A. A., Baartman, J., Ballabio, C., et al. (2021). Soil Erosion Modelling: A Global Review and Statistical Analysis. Sci. Total Environ. 780, 146494. doi:10.1016/j.scitotenv.2021.146494
Brown, L. C., and Foster, G.R. (1987). Storm Erosivity Using Idealized Intensity Distributions. Trans. ASAE 30, 0379–0386. doi:10.13031/2013.31957
Carollo, F. G., and Ferro, V. (2015). Modeling Rainfall Erosivity by Measured Drop-Size Distributions. J. Hydrol. Eng. 20. doi:10.1061/(ASCE)HE.1943-5584.0001077
Carollo, F. G., Ferro, V., and Serio, M. A. (2016). Estimating Rainfall Erosivity by Aggregated Drop Size Distributions. Hydrol. Process. 30, 2119–2128. doi:10.1002/hyp.10776
Carollo, F. G., Ferro, V., and Serio, M. A. (2017). Reliability of Rainfall Kinetic Power-Intensity Relationships. Hydrol. Process. 31, 1293–1300. doi:10.1002/hyp.11099
Cerro, C., Bech, J., Codina, B., and Lorente, J. (1998). Modeling Rain Erosivity Using Disdrometric Techniques. Soil Sci. Soc. America J. 62, 731–735. doi:10.2136/sssaj1998.03615995006200030027x
de Luis, M., Čufar, K., Saz, M. A., Longares, L. A., Ceglar, A., and Kajfež-Bogataj, L. (2014). Trends in Seasonal Precipitation and Temperature in Slovenia during 1951-2007. Reg. Environ. Change 14, 1801–1810. doi:10.1007/s10113-012-0365-7
Diodato, N., and Bellocchi, G. (2007). Estimating Monthly (R)USLE Climate Input in a Mediterranean Region Using Limited Data. J. Hydrol. 345, 224–236. doi:10.1016/j.jhydrol.2007.08.008
Dolšak, D., Bezak, N., and Šraj, M. (2016). Temporal Characteristics of Rainfall Events under Three Climate Types in Slovenia. J. Hydrol. 541, 1395–1405. doi:10.1016/j.jhydrol.2016.08.047
Frasson, R. P. D. M., da Cunha, L. K., and Krajewski, W. F. (2011). Assessment of the Thies Optical Disdrometer Performance. Atmos. Res. 101, 237–255. doi:10.1016/j.atmosres.2011.02.014
Fu, Z., Dong, X., Zhou, L., Cui, W., Wang, J., Wan, R., et al. (2020). Statistical Characteristics of Raindrop Size Distributions and Parameters in Central China during the Meiyu Seasons. J. Geophys. Res. Atmos. 125. doi:10.1029/2019JD031954
Guyot, A., Pudashine, J., Protat, A., Uijlenhoet, R., Pauwels, V. R. N., Seed, A., et al. (2019). Effect of Disdrometer Type on Rain Drop Size Distribution Characterisation: A New Dataset for South-Eastern Australia. Hydrol. Earth Syst. Sci. 23, 4737–4761. doi:10.5194/hess-23-4737-2019
Hernando, D., and Romana, M. G. (2015). Estimating the Rainfall Erosivity Factor from Monthly Precipitation Data in the Madrid Region (Spain). J. Hydrol. Hydromech. 63, 55–62. doi:10.1515/johh-2015-0003
Hernando, D., and Romana, M. G. (2016). Estimate of the (R)USLE Rainfall Erosivity Factor from Monthly Precipitation Data in mainland Spain. J. Iber. Geol. 42, 113–124. doi:10.5209/rev_JIGE.2016.v42.n1.49120
Hoyos, N., Waylen, P. R., and Jaramillo, Á. (2005). Seasonal and Spatial Patterns of Erosivity in a Tropical Watershed of the Colombian Andes. J. Hydrol. 314, 177–191. doi:10.1016/j.jhydrol.2005.03.014
Jemec Auflič, M., Jež, J., Popit, T., Košir, A., Maček, M., Logar, J., et al. (2017). The Variety of Landslide Forms in Slovenia and its Immediate NW Surroundings. Landslides 14, 1537–1546. doi:10.1007/s10346-017-0848-1
Johannsen, L. L., Zambon, N., Strauss, P., Dostal, T., Neumann, M., Zumr, D., et al. (2020a). Comparison of Three Types of Laser Optical Disdrometers under Natural Rainfall Conditions. Hydrol. Sci. J. 65, 524–535. doi:10.1080/02626667.2019.1709641
Johannsen, L. L., Zambon, N., Strauss, P., Dostal, T., Neumann, M., Zumr, D., et al. (2020b). Impact of Disdrometer Types on Rainfall Erosivity Estimation. Water 12, 963. doi:10.3390/w12040963
Joss, J., and Waldvogel, A. (1967). A Spectrograph for Raindrops with Automatic Interpretation. Pure Appl. Geophys. 68, 240–246. doi:10.1007/bf00874898
Krklec, K., Domínguez-Villar, D., and Lojen, S. (2018). The Impact of Moisture Sources on the Oxygen Isotope Composition of Precipitation at a continental Site in central Europe. J. Hydrol. 561, 810–821. doi:10.1016/j.jhydrol.2018.04.045
Lanza, L. G., and Vuerich, E. (2009). The WMO Field Intercomparison of Rain Intensity Gauges. Atmos. Res. 94, 534–543. doi:10.1016/j.atmosres.2009.06.012
Lanza, L. G., and Vuerich, E. (2012). Non-parametric Analysis of One-Minute Rain Intensity Measurements from the WMO Field Intercomparison. Atmos. Res. 103, 52–59. doi:10.1016/j.atmosres.2011.04.021
Ma, L., Zhao, L., Yang, D., Xiao, Y., Zhang, L., and Qiao, Y. (2019). Analysis of Raindrop Size Distribution Characteristics in Permafrost Regions of the Qinghai-Tibet Plateau Based on New Quality Control Scheme. Water 11, 2265. doi:10.3390/w11112265
Meusburger, K., Steel, A., Panagos, P., Montanarella, L., and Alewell, C. (2012). Spatial and Temporal Variability of Rainfall Erosivity Factor for Switzerland. Hydrol. Earth Syst. Sci. 16, 167–177. doi:10.5194/hess-16-167-2012
Michaelides, S., Levizzani, V., Anagnostou, E., Bauer, P., Kasparis, T., and Lane, J. E. (2009). Precipitation: Measurement, Remote Sensing, Climatology and Modeling. Atmos. Res. 94, 512–533. doi:10.1016/j.atmosres.2009.08.017
Mikhailova, E. A., Bryant, R. B., Schwager, S. J., and Smith, S. D. (1997). Predicting Rainfall Erosivity in Honduras. Soil Sci. Soc. Am. J. 61, 273–279. doi:10.2136/sssaj1997.03615995006100010039x
Mikoš, M. (2020a). After 2000 Stože Landslide: Part I - Development in Landslide Research in Slovenia. Acta Hydrotech. 33, 129–153. doi:10.15292/acta.hydro.2020.09
Mikoš, M. (2020b). Flood hazard in Slovenia and Assessment of Extreme Design Floods. Acta Hydrotech. 33, 43–59. doi:10.15292/acta.hydro.2020.04
Mikoš, M. (2021). After 2000 Stože Landslide: Part II - Development of Landslide Disaster Risk Reduction Policy in Slovenia. Acta Hydrotech. 34, 39–59. doi:10.15292/acta.hydro.2021.04
Mikoš, M., Brilly, M., Fazarinc, R., and Ribičič, M. (2006). Strug Landslide in W Slovenia: A Complex Multi-Process Phenomenon. Eng. Geol. 83, 22–35. doi:10.1016/j.enggeo.2005.06.037
Mineo, C., Ridolfi, E., Moccia, B., Russo, F., and Napolitano, F. (2019). Assessment of Rainfall Kinetic-Energy-Intensity Relationships. Water 11, 1994. doi:10.3390/w11101994
Mohr, C. H., Coppus, R., Iroumé, A., Huber, A., and Bronstert, A. (2013). Runoff Generation and Soil Erosion Processes after clear Cutting. J. Geophys. Res. Earth Surf. 118, 814–831. doi:10.1002/jgrf.20047
Mondal, A., Khare, D., and Kundu, S. (2016). Change in Rainfall Erosivity in the Past and Future Due to Climate Change in the central Part of India. Int. Soil Water Conserv. Res. 4, 186–194. doi:10.1016/j.iswcr.2016.08.004
Montero-Martínez, G., Torres-Pérez, E. F., and García-García, F. (2016). A Comparison of Two Optical Precipitation Sensors with Different Operating Principles: The PWS100 and the OAP-2DP. Atmos. Res. 178-179, 550–558. doi:10.1016/j.atmosres.2016.05.007
Montero-Martínez, G., García-García, F., and Arenal-Casas, S. (2020). The Change of Rainfall Kinetic Energy Content with Altitude. J. Hydrol. 584, 124685. doi:10.1016/j.jhydrol.2020.124685
Muñoz, P., Célleri, R., and Feyen, J. (2016). Effect of the Resolution of Tipping-Bucket Rain Gauge and Calculation Method on Rainfall Intensities in an Andean Mountain Gradient. Water 8, 534. doi:10.3390/w8110534
Murata, F., Terao, T., Chakravarty, K., Syiemlieh, H. J., and Cajee, L. (2020). Characteristics of Orographic Rain Drop-Size Distribution at Cherrapunji, Northeast India. Atmosphere 11, 777. doi:10.3390/ATMOS11080777
Nearing, M. A., Unkrich, C. L., Goodrich, D. C., Nichols, M. H., and Keefer, T. O. (2015). Temporal and Elevation Trends in Rainfall Erosivity on a 149 Km 2 Watershed in a Semi-arid Region of the American Southwest. Int. Soil Water Conserv. Res. 3, 77–85. doi:10.1016/j.iswcr.2015.06.008
Nel, W., and Sumner, P. D. (2007). Intensity, Energy and Erosivity Attributes of Rainstorms in the KwaZulu-Natal Drakensberg, South Africa. S. Afr. J. Sci. 103, 398–402.
Nel, W., Reynhardt, D. A., and Sumner, P. D. (2010). Effect of Altitude on Erosive Characteristics of Concurrent Rainfall Events in the Northern Kwazulu-Natal Drakensberg. Water SA 36, 509–512. doi:10.4314/wsa.v36i4.58429
Orellana-Alvear, J., Célleri, R., Rollenbeck, R., and Bendix, J. (2017). Analysis of Rain Types and Their Z-R Relationships at Different Locations in the High andes of Southern Ecuador. J. Appl. Meteorol. Climatol. 56, 3065–3080. doi:10.1175/JAMC-D-17-0009.1
OTT Pluvio (2020). OTT Pluvio² L – Weighing Rain Gauge. Available at: https://www.ott.com/en-uk/products/meteorological-sensors-101/ott-pluvio2-l-weighing-rain-gauge-2374/ (Accessed June 15, 2021).
Panagos, P., Ballabio, C., Borrelli, P., Meusburger, K., Klik, A., Rousseva, S., et al. (2015a). Rainfall Erosivity in Europe. Sci. Total Environ. 511, 801–814. doi:10.1016/j.scitotenv.2015.01.008
Panagos, P., Borrelli, P., Poesen, J., Ballabio, C., Lugato, E., Meusburger, K., et al. (2015b). The New Assessment of Soil Loss by Water Erosion in Europe. Environ. Sci. Pol. 54, 438–447. doi:10.1016/j.envsci.2015.08.012
Panagos, P., Ballabio, C., Borrelli, P., and Meusburger, K. (2016a). Spatio-temporal Analysis of Rainfall Erosivity and Erosivity Density in Greece. Catena 137, 161–172. doi:10.1016/j.catena.2015.09.015
Panagos, P., Borrelli, P., Spinoni, J., Ballabio, C., Meusburger, K., Beguería, S., et al. (2016b). Monthly Rainfall Erosivity: Conversion Factors for Different Time Resolutions and Regional Assessments. Water 8, 119. doi:10.3390/w8040119
Petan, S., Rusjan, S., Vidmar, A., and Mikoš, M. (2010). The Rainfall Kinetic Energy-Intensity Relationship for Rainfall Erosivity Estimation in the Mediterranean Part of Slovenia. J. Hydrol. 391, 314–321. doi:10.1016/j.jhydrol.2010.07.031
Petan, S. (2010). Measurements and Spatial Modelling of Rainfall Erosivity as a Soil Erosion Factor. Available at: https://repozitorij.uni-lj.si/Dokument.php?id=83437&lang=slv (Accessed June 15, 2021).
Petek, M., Mikoš, M., and Bezak, N. (2018). Rainfall Erosivity in Slovenia: Sensitivity Estimation and Trend Detection. Environ. Res. 167, 528–535. doi:10.1016/j.envres.2018.08.020
Petkovšek, G., and Mikoš, M. (2004). Estimating the R factor from daily rainfall data in the sub-Mediterranean climate of southwest Slovenia | Estimation du facteur R à partir de données journalières de pluie dans le climat sub-méditerranéen du Sud-Ouest de la Slovénie. Hydrol. Sci. J. 49, 869–877. doi:10.1623/hysj.49.5.869.55134
Raupach, T. H., and Berne, A. (2015). Correction of Raindrop Size Distributions Measured by Parsivel Disdrometers, Using a Two-Dimensional Video Disdrometer as a Reference. Atmos. Meas. Tech. 8, 343–365. doi:10.5194/amt-8-343-2015
Renard, K. G., Foster, G. R., Weesies, G. A., McCool, D. K., and Yoder, D. C. (1997). Predicting Soil Erosion byWater: A Guide to Conservation Planning with the Revised Universal Soil Loss Equation (RUSLE) (Agricultural Handbook 703). Washington, DC: United States Department of Agriculture, Agricultural Research Service.
Rusjan, S., Kobold, M., and Mikoš, M. (2009). Characteristics of the Extreme Rainfall Event and Consequent Flash Floods in W Slovenia in September 2007. Nat. Hazards Earth Syst. Sci. 9, 947–956. doi:10.5194/nhess-9-947-2009
Rusjan, S., Sapač, K., Petrič, M., Lojen, S., and Bezak, N. (2019). Identifying the Hydrological Behavior of a Complex Karst System Using Stable Isotopes. J. Hydrol. 577, 123956. doi:10.1016/j.jhydrol.2019.123956
Sanchez-Moreno, J. F., Mannaerts, C. M., and Jetten, V. (2014). Rainfall Erosivity Mapping for Santiago Island, Cape Verde. Geoderma 217-218, 74–82. doi:10.1016/j.geoderma.2013.10.026
Sapač, K., Bezak, N., Vidmar, A., and Rusjan, S. (2021). Nitrate Nitrogen (NO3-N) Export Regimes Based on High-Frequency Measurements in the Kuzlovec Stream Catchment. Acta Hydrotech. 34, 25–38. doi:10.15292/acta.hydro.2021.03
Serio, M. A., Carollo, F. G., and Ferro, V. (2019). Raindrop Size Distribution and Terminal Velocity for Rainfall Erosivity Studies. A Review. J. Hydrol. 576, 210–228. doi:10.1016/j.jhydrol.2019.06.040
Thies Clima: Laser Precipitation Monitor (2020). Thies Clima: Laser Precipitation Monitor. Available at: https://www.thiesclima.com/en/Products/Precipitation-Electrical-devices/?art=779 (Accessed June 15, 2021).
Tokay, A., Bashor, P. G., and Wolff, K. R. (2005). Error Characteristics of Rainfall Measurements by Collocated Joss-Waldvogel Disdrometers. J. Atmos. Ocean. Technol. 22, 513–527. doi:10.1175/JTECH1734.1
Tokay, A., Petersen, W. A., Gatlin, P., and Wingo, M. (2013). Comparison of Raindrop Size Distribution Measurements by Collocated Disdrometers. J. Atmos. Ocean. Technol. 30, 1672–1690. doi:10.1175/JTECH-D-12-00163.1
Wilken, F., Baur, M., Sommer, M., Deumlich, D., Bens, O., and Fiener, P. (2018). Uncertainties in Rainfall Kinetic Energy-Intensity Relations for Soil Erosion Modelling. Catena 171, 234–244. doi:10.1016/j.catena.2018.07.002
Wischmeier, W. H., and Smith, D. D. (1978). Predicting Rainfall Erosion Losses: A Guide to Conservation Planning [USA]. Washington, DC: United States Department of Agriculture.
Yin, S., Nearing, M. A., Borrelli, P., and Xue, X. (2017). Rainfall Erosivity: An Overview of Methodologies and Applications. Vadose Zone J. 16, vzj2017.06.0131. doi:10.2136/vzj2017.06.0131
Yue, T., Xie, Y., Yin, S., Yu, B., Miao, C., and Wang, W. (2020). Effect of Time Resolution of Rainfall Measurements on the Erosivity Factor in the USLE in China. Int. Soil Water Conservation Res. 8, 373–382. doi:10.1016/j.iswcr.2020.06.001
Keywords: rainfall erosivity, kinetic energy, disdrometer, altitude, climate, Slovenia
Citation: Bezak N, Petan S and Mikoš M (2021) Spatial and Temporal Variability in Rainfall Erosivity Under Alpine Climate: A Slovenian Case Study Using Optical Disdrometer Data. Front. Environ. Sci. 9:735492. doi: 10.3389/fenvs.2021.735492
Received: 02 July 2021; Accepted: 10 September 2021;
Published: 13 October 2021.
Edited by:
Gianni Bellocchi, French National Institute for Agriculture, Food and Environment, FranceReviewed by:
Gabriele Buttafuoco, National Research Council (CNR), ItalyWiesława Kasperska-Wołowicz, Institute of Technology and Life Sciences, Poland
Copyright © 2021 Bezak, Petan and Mikoš. This is an open-access article distributed under the terms of the Creative Commons Attribution License (CC BY). The use, distribution or reproduction in other forums is permitted, provided the original author(s) and the copyright owner(s) are credited and that the original publication in this journal is cited, in accordance with accepted academic practice. No use, distribution or reproduction is permitted which does not comply with these terms.
*Correspondence: Nejc Bezak, nejc.bezak@fgg.uni-lj.si